Mastering your Google Ads dashboard is essential for optimizing your digital marketing campaigns. By closely monitoring campaign performance metrics such as conversions, clicks, and other key metrics, you can make data-driven decisions to improve your ad campaigns and boost ROI. With a well-optimized dashboard, you can easily track the success of your Google Ads campaigns and make adjustments in real-time to ensure maximum impact.
Key Takeaways:
- The Google Ads dashboard is crucial for optimizing your digital marketing campaigns.
- By monitoring key metrics, such as conversions and clicks, you can make data-driven decisions to improve ad performance.
- A well-designed dashboard allows you to track real-time campaign success and make adjustments accordingly.
- Optimizing your dashboard saves time and helps improve the efficiency of your marketing efforts.
- Data visualization in the dashboard provides valuable insights for better decision-making.
The Importance of a Google Ads Dashboard
A Google Ads dashboard is an indispensable tool for tracking and analyzing the performance of your ad campaigns. It serves as a centralized hub, allowing you to monitor crucial metrics and gain valuable insights into the effectiveness of your marketing efforts. By utilizing a well-designed dashboard, you can easily visualize and analyze campaign data, identify trends, and make strategic decisions to optimize your ad campaigns for better results.
With a Google Ads dashboard, you can monitor various key metrics, including conversions, clicks, and other performance indicators that directly impact the success of your ad campaigns. This visibility and real-time data give you the power to understand how your campaigns are performing, enabling you to identify areas of improvement and make informed decisions to refine your advertising strategy.
A well-optimized dashboard also offers the flexibility to customize your view and focus on the most relevant metrics for your specific ad campaigns. You can configure the dashboard to display the performance data that matters most to you, providing a clear and concise overview of your campaign’s effectiveness.
Furthermore, a Google Ads dashboard empowers you to analyze campaign data and identify valuable insights that may have otherwise been overlooked. By visualizing your data through charts, graphs, and reports, you can uncover trends and patterns that provide meaningful context to your ad campaign performance.
Overall, a Google Ads dashboard is an essential tool that helps you maximize the impact of your ad campaigns. It allows you to continually monitor and optimize your campaigns by providing real-time data and insights. With its ability to track performance metrics, analyze data, and make data-driven decisions, a well-utilized dashboard is crucial for achieving your advertising goals and driving success in the ever-competitive digital landscape.
| Metric | Description |
|---|---|
| Conversions | The number of desired actions completed on your website, such as a purchase, sign-up, or download. |
| Clicks | The number of times users click on your ads, indicating engagement with your campaign. |
| Impressions | The number of times your ads are shown to users, providing insights into reach and visibility. |
| Click-through rate (CTR) | The percentage of users who click on your ad after seeing it, reflecting ad relevancy and effectiveness. |
| Cost per conversion | The average cost of acquiring one conversion, providing insights into the financial efficiency of your campaigns. |
Benefits of Using a Google Ads Dashboard
Using a Google Ads dashboard offers several benefits for digital marketers. First, it allows you to optimize your campaigns by providing real-time data on metrics such as click-through rate (CTR), return on investment (ROI), and other performance indicators. This enables you to make quick adjustments and optimize your ad spend for maximum results.
Additionally, a well-designed dashboard offers data visualization capabilities, making it easier to understand and interpret campaign data, and derive actionable insights for improving your marketing strategy. By presenting data in visually appealing charts and graphs, you can easily identify trends and patterns that may not be apparent in raw data. This empowers you to make data-driven decisions and take steps to optimize your campaigns effectively.
| Benefits | Description |
|---|---|
| Real-time data | Access real-time data on key performance metrics, such as CTR and ROI, to make timely adjustments and optimize ad spend. |
| Data visualization | Easily interpret campaign data through visually appealing charts and graphs, enabling you to derive actionable insights for improvement. |
| Optimize campaign performance | Make data-driven decisions and take actions to improve the performance of your Google Ads campaigns. |
“A well-designed Google Ads dashboard provides real-time data visualization, enabling marketers to optimize campaign performance and drive actionable insights.”
Key Features of a Google Ads Dashboard
A comprehensive Google Ads dashboard offers a range of features that empower digital marketers to effectively monitor and manage their ad campaigns. With these key features, you can track campaign performance in real-time, analyze crucial metrics, and create custom reports to visualize campaign data.
Real-Time Monitoring
The Google Ads dashboard allows you to monitor your campaign performance in real-time, providing instant insights into the effectiveness of your ads. With up-to-date data at your fingertips, you can quickly identify any changes in performance and take immediate action to optimize your campaigns.
Track Key Metrics
Monitor the performance of your ads with ease by tracking key metrics within the Google Ads dashboard. Whether it’s impressions, clicks, conversions, or other performance indicators, you can access these metrics in a centralized location, allowing for comprehensive campaign analysis.
Custom Report Creation
Create custom reports tailored to your specific needs using the Google Ads dashboard. This feature enables you to visualize campaign data in a way that makes the most sense for your analysis, highlighting the metrics that are most relevant to your advertising goals.
Widgets and Customizable Templates
The dashboard may include widgets and customizable templates that offer enhanced reporting capabilities. With widgets, you can easily access and display key metrics, such as cost-per-click (CPC) or click-through rate (CTR), for quick reference. Customizable templates allow you to further personalize your reporting, aligning it with your specific requirements.
“The Google Ads dashboard provides a comprehensive set of features that enable marketers to easily track campaign performance, analyze data, and make informed decisions to optimize their marketing efforts.”
By leveraging these key features, you can effectively monitor the success of your Google Ads campaigns, identify areas for improvement, and make data-driven decisions to optimize your marketing efforts.
| Feature | Description |
|---|---|
| Real-Time Monitoring | Track campaign performance in real-time |
| Key Metric Tracking | Monitor crucial metrics for comprehensive analysis |
| Custom Report Creation | Create personalized reports based on specific needs |
| Widgets and Customizable Templates | Access enhanced reporting capabilities through widgets and templates |
How to Optimize Your Google Ads Dashboard
Optimizing your Google Ads dashboard is essential to maximize the effectiveness of your ad campaigns. By utilizing dashboard examples and templates that focus on key metrics such as cost per conversion and return on investment (ROI), you can gain valuable insights and make informed decisions to improve your campaign performance.
To get started, consider customizing your dashboard to prominently display these important metrics. By having a clear view of your cost per conversion and ROI, you can easily monitor the financial performance and profitability of your campaigns. This visibility allows you to identify areas where you can optimize your ad spend and make data-driven decisions to drive better results.
Regularly reviewing and analyzing the data presented in your dashboard is crucial for identifying opportunities to improve your campaigns. By monitoring the performance metrics associated with cost per conversion and ROI, you can pinpoint areas where adjustments can be made to increase conversions and boost your return on investment.
Here are some steps to optimize your Google Ads dashboard:
- Identify the key performance metrics that align with your campaign goals.
- Choose dashboard examples and templates that focus on cost per conversion and ROI.
- Customize your dashboard to prominently display these metrics.
- Regularly review and analyze the data to identify areas for improvement.
- Make data-driven decisions to optimize your ad campaigns based on the insights gained.
By following these optimization strategies, you can unlock the full potential of your Google Ads dashboard and drive better results for your ad campaigns.
| Dashboard Examples | Focus |
|---|---|
| Conversion Funnel Dashboard | Visualize and analyze the conversion journey to identify areas for optimization. |
| ROI Dashboard | Track and measure the return on investment of your ad campaigns. |
| Cost Per Conversion Dashboard | Monitor and optimize the cost per conversion to maximize profitability. |
Best Practices for Google Ads Dashboard Design
When designing your Google Ads dashboard, it’s important to follow best practices to ensure effective data visualization and maximize the use of key performance metrics. By implementing these practices, you can create a customized dashboard that provides clear insights into your ad campaigns and helps you make data-driven decisions.
Consider Your Data Sources
Start by considering the sources of data you want to include in your Google Ads dashboard. This may include data from Google Ads, Google Analytics, and other relevant platforms. By integrating these data sources, you can gain a comprehensive view of your campaign performance and identify areas for improvement.
Choose the Right Metrics
Next, choose the metrics and performance indicators that align with your campaign goals. Focus on the metrics that are most relevant to your objectives, such as click-through rate (CTR), conversion rate, and return on ad spend (ROAS). These metrics will help you track the success of your campaigns and make informed optimization decisions.
Customize the Layout
Customize the layout of your Google Ads dashboard to prioritize the most important information. Organize the data in a way that is visually appealing and makes it easy to understand. Consider using charts, graphs, and other visual elements to present data in a clear and concise manner.
“A well-designed dashboard should provide a snapshot of your campaign performance and allow you to quickly identify trends, patterns, and areas for improvement.” – Jane Smith, Digital Marketing Expert
Make the Dashboard Easy to Navigate
Ensure that your Google Ads dashboard is easy to navigate by providing clear labels and intuitive design. Include a menu or navigation section that allows you to switch between different views or reports. This will make it easier for you to access the specific data you need to analyze and optimize your campaigns.
Regularly Review and Update
Lastly, make it a practice to regularly review and update your Google Ads dashboard based on changing campaign needs and goals. As your campaigns evolve, you may need to adjust the metrics you track or include additional data sources. By staying proactive, you can ensure that your dashboard continues to provide valuable insights to drive your marketing strategy forward.
| Best Practices for Google Ads Dashboard Design | |
|---|---|
| Consider Your Data Sources | Integrate data from Google Ads, Google Analytics, and other relevant platforms for a comprehensive view of campaign performance. |
| Choose the Right Metrics | Focus on metrics such as CTR, conversion rate, and ROAS that align with your campaign goals. |
| Customize the Layout | Create a visually appealing layout that prioritizes important information and utilizes charts and graphs. |
| Make the Dashboard Easy to Navigate | Ensure clear labels and intuitive design for easy navigation and quick access to data. |
| Regularly Review and Update | Continuously review and update your dashboard to reflect changing campaign needs and goals. |
The Role of Google Ads Dashboard in Campaign Management
A Google Ads dashboard plays a crucial role in campaign management, providing valuable insights into the performance and effectiveness of your ad campaigns. With the integration of Google Ads analytics and other tools, you can gain a comprehensive view of your campaigns and make informed decisions to improve your overall marketing strategy.
By utilizing the Google Ads dashboard, you can track key metrics such as impressions, clicks, conversions, and cost-per-click (CPC). These metrics help you assess the performance of your campaigns, identify areas for optimization, and allocate your budget effectively.
Moreover, with the ability to analyze data and identify trends, the dashboard allows you to make data-driven decisions to optimize your campaigns. By monitoring performance metrics, you can adjust your ad targeting, refine your keywords, and make strategic enhancements that align with your campaign objectives.
Additionally, the dashboard provides a centralized hub for monitoring the results of your ad campaigns in real-time. This real-time data allows you to quickly react to changes, capitalize on emerging trends, and make timely adjustments to maximize your campaign’s impact.
One of the key advantages of the Google Ads dashboard is the availability of various tools that complement your campaign management efforts. For instance, you can utilize the Keyword Planner tool to research and discover relevant keywords, the Ad Preview and Diagnosis tool to test your ads, and the Auction Insights report to gain insights into your competitors’ performance.
The Benefits of Google Ads Campaign Management
When it comes to managing your Google Ads campaigns, the right tools and resources can make all the difference. The Google Ads dashboard provides you with valuable features and benefits to streamline your campaign management process:
- Performance Monitoring: Track key metrics, analyze data, and gauge the success of your ads.
- Budget Optimization: Allocate your budget effectively based on the performance of your campaigns.
- Data Visualization: Visualize campaign data to identify trends, patterns, and areas for improvement.
- Real-Time Insights: Monitor your campaigns in real-time and make timely adjustments.
- Competitor Analysis: Gain insights into your competitors’ performance and refine your strategies.
With these features, the Google Ads dashboard empowers you to manage your campaigns effectively, make informed decisions, and achieve your desired marketing objectives.
Example of Google Ads Dashboard
Here is an example of a Google Ads dashboard:
“`html
| Metric | Impressions | Clicks | Conversions | CPC |
|---|---|---|---|---|
| Today | 1,500 | 200 | 10 | $2.50 |
| Yesterday | 1,800 | 250 | 12 | $2.75 |
| Last 7 Days | 10,500 | 1,500 | 80 | $2.60 |
As illustrated in the example above, the Google Ads dashboard provides a comprehensive overview of key metrics such as impressions, clicks, conversions, and cost-per-click (CPC). This allows you to monitor the performance of your campaigns and make data-driven decisions to optimize your marketing strategy.
How a Google Ads Dashboard Saves Time and Improves Efficiency
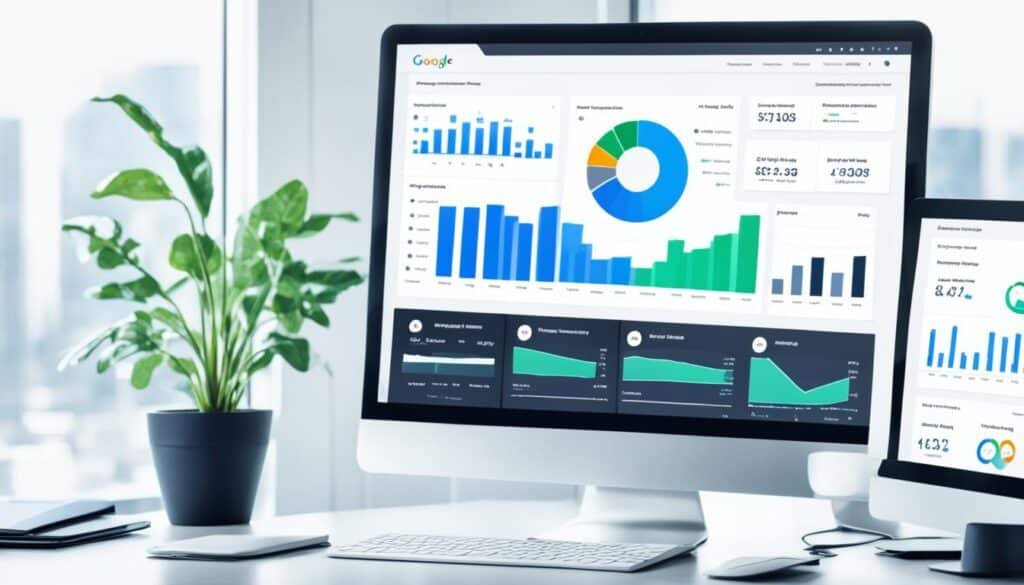
One of the significant advantages of using a Google Ads dashboard is the time-saving aspect. By automating data collection and report generation, a well-designed dashboard saves you time and effort. It allows you to access actionable insights quickly and make informed decisions without the need for manual data gathering and analysis. With these time-saving features, you can focus on other essential tasks and optimize your digital marketing campaigns more efficiently.
Automating Data Collection
With a Google Ads dashboard, you can automate the process of collecting data from your ad campaigns. Instead of manually extracting data from multiple sources and compiling it into reports, the dashboard gathers the necessary information in real-time. This automation not only saves you time but also reduces the risk of errors or missing important data points.
Streamlined Report Generation
In addition to automating data collection, a well-designed Google Ads dashboard simplifies the process of generating reports. You can customize the dashboard to generate reports automatically based on your selected metrics and time intervals. This streamlines the reporting process, allowing you to quickly access comprehensive and up-to-date performance data without spending hours manually creating reports.
Access to Actionable Insights
A Google Ads dashboard provides you with actionable insights that can inform your marketing decisions. By consolidating data from your ad campaigns into a single interface, the dashboard enables you to identify trends, spot opportunities, and address issues promptly. With access to real-time data and performance metrics, you can make data-driven decisions that maximize your advertising ROI and drive better results.
| Benefits | Explanation |
|---|---|
| Time Savings | Automated data collection and report generation save time and effort. |
| Efficiency | Quick access to actionable insights allows for informed decision-making. |
| Data Accuracy | Automated data collection reduces the risk of human errors. |
Overall, a Google Ads dashboard serves as a valuable tool for digital marketers, enabling them to save time, automate data processes, and gain actionable insights. By leveraging the power of automation and data visualization, you can optimize your advertising campaigns more efficiently and achieve your marketing goals.
The Power of Data Visualization in a Google Ads Dashboard
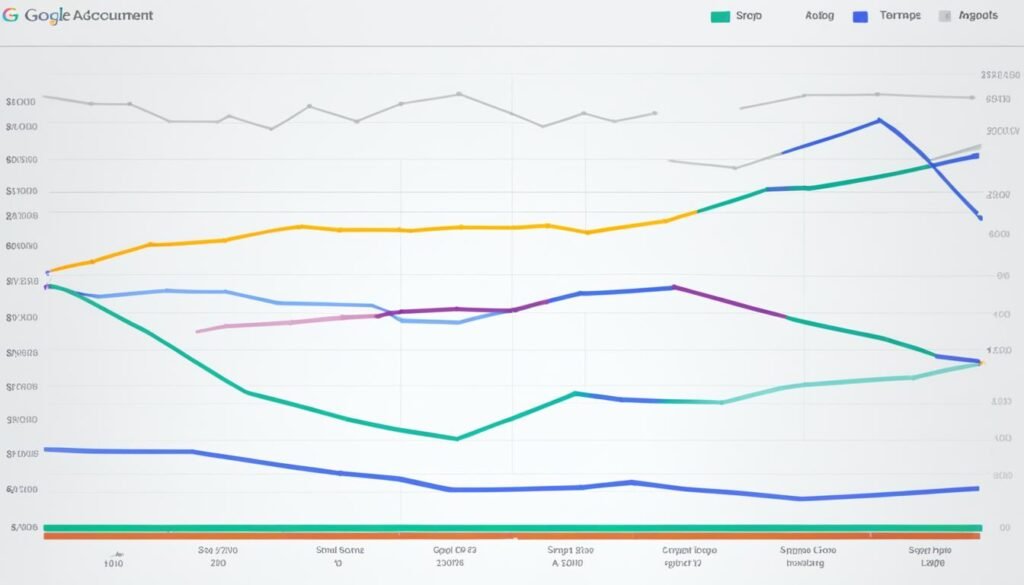
Data visualization is a crucial aspect of a Google Ads dashboard that allows marketers to gain actionable insights from complex campaign data. By presenting data in visually appealing charts and graphs, marketers can understand trends, patterns, and correlations that may not be evident in raw data alone.
Effective data visualization in the Google Ads dashboard enables marketers to have a deeper understanding of their ad spend, performance metrics, and overall campaign performance. Visual representations help highlight important information and make it easier to communicate campaign insights to stakeholders.
Through data visualization, marketers can analyze campaign data at a glance and make data-driven decisions to optimize their ad campaigns for better results. Whether it’s tracking the performance of specific keywords, comparing the effectiveness of different ad creatives, or identifying the most profitable target audience segments, visualizing data helps marketers derive meaningful insights and take appropriate actions.
For example, a line chart can illustrate the fluctuation of ad spend over time, allowing marketers to identify periods of increased spending and correlate that with the performance metrics. A bar graph can showcase the conversion rates of various ad campaigns, making it easy to compare their effectiveness side by side.
“Data visualization is a powerful tool that helps marketers unlock valuable insights and make informed decisions based on campaign performance. It allows us to see the bigger picture and identify trends that can significantly impact our ad spend and overall marketing strategy.”
Example of Data Visualization in a Google Ads Dashboard
| Metrics | Visualization |
|---|---|
| Ad Spend | |
| Conversion Rate | 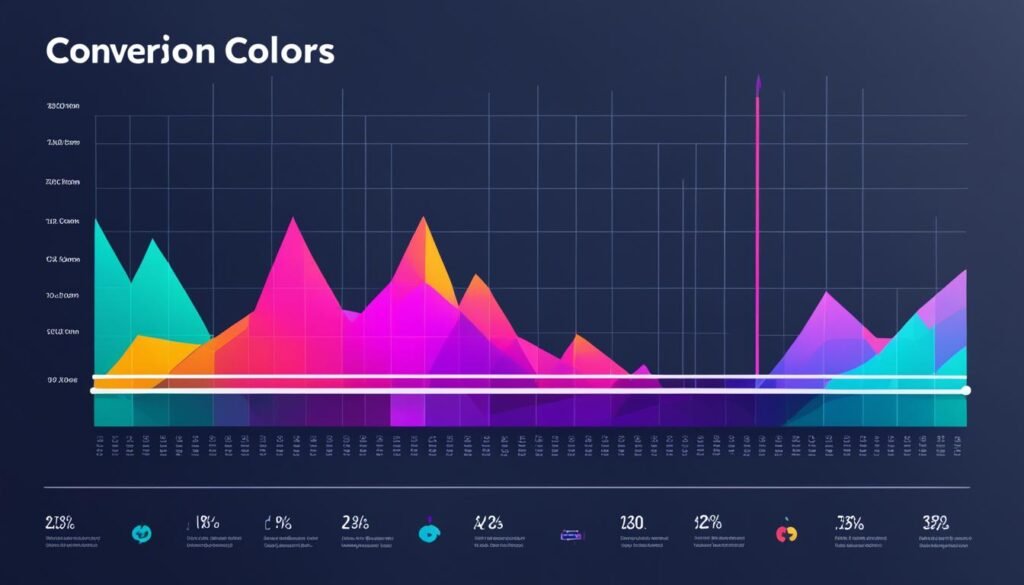 |
| Click-Through Rate (CTR) | 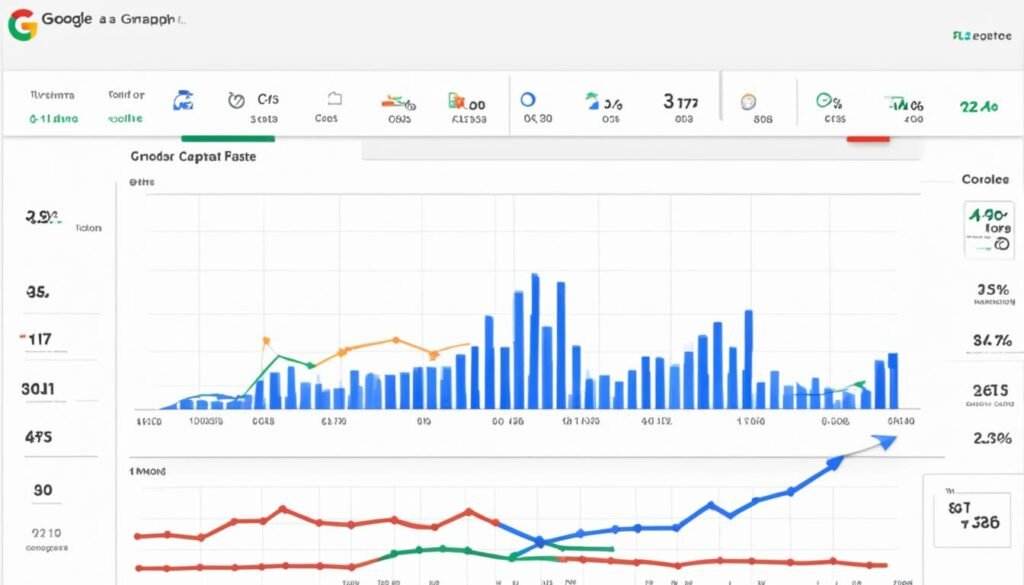 |
The table above presents an example of data visualization in a Google Ads dashboard, showcasing key metrics such as ad spend, conversion rate, and click-through rate. Each visualization provides a clear representation of the respective metric, enabling marketers to quickly interpret the data and make data-driven decisions.
By leveraging the power of data visualization in a Google Ads dashboard, marketers can optimize their ad campaigns, allocate budgets effectively, and drive better performance metrics. It empowers marketers with the ability to dig deeper into campaign data, identify opportunities, and make informed decisions that ultimately lead to improved results.
Also Read: Get Help Fast From Google Ads Customer Service
Conclusion
The Google Ads dashboard is an essential tool for digital marketers looking to optimize their online marketing efforts. With its centralized hub for tracking, analyzing, and visualizing key campaign metrics, marketers can make data-driven decisions and drive actionable insights.
By monitoring campaign performance in real-time, marketers can quickly identify areas for improvement and make timely adjustments to their strategies. Customizable dashboards allow for a personalized view of the most relevant metrics, empowering marketers to focus on what matters most for their specific campaigns.
The automation of reporting processes not only saves time but also enables marketers to stay on top of their campaign performance without the need for manual data gathering and analysis. With the Google Ads dashboard, marketers can maximize the ROI of their ad campaigns and achieve their marketing goals more effectively.
In the fast-paced world of digital marketing, having a comprehensive and user-friendly dashboard like Google Ads is crucial. It provides marketers with the insights they need to make informed decisions, optimize their online marketing efforts, and stay ahead of the competition in the ever-evolving landscape of digital marketing.
FAQs
Q: What is Google Ads and why is it important for digital marketing?
A: Google Ads, formerly known as Google AdWords, is a pay-per-click advertising platform by Google that allows businesses to display ads on Google’s search engine results and its advertising network. It is crucial for digital marketing as it helps businesses reach potential customers with targeted ads based on keywords and demographics.
Q: How can I track the performance of my Google Ads campaigns?
A: You can track the performance of your Google Ads campaigns by monitoring key performance indicators (KPIs) such as click-through rate (CTR), conversion rate, cost per click (CPC), and return on investment (ROI) using Google Ads dashboard and reporting tools.
Q: What is the significance of conversion tracking in Google Ads?
A: Conversion tracking in Google Ads is crucial as it allows you to measure the effectiveness of your ad campaigns by tracking actions that users take after clicking on your ads, such as making a purchase or filling out a contact form.
Q: How can I create custom Google Ads dashboard templates?
A: You can create custom Google Ads dashboard templates by using tools like Google Data Studio or other reporting tools that allow you to connect to your Google Ads account and visualize performance metrics such as impressions, clicks, and conversions.
Q: What are some key metrics to consider when analyzing Google Ads performance?
A: Some key metrics to consider when analyzing Google Ads performance include cost per conversion, click-through rate (CTR), conversion rate, cost per click (CPC), and return on investment (ROI).
Q: Can I white label my Google Ads reporting to show to clients?
A: Yes, you can white label your Google Ads reporting by customizing the dashboard template or using reporting tools that allow you to add your branding and present the data in a professional format to clients.
Q: How can I optimize my Google Ads campaigns for better performance?
A: You can optimize your Google Ads campaigns for better performance by analyzing search terms, refining keywords, testing new ad creatives, adjusting bid strategies, and monitoring performance metrics regularly to make data-driven decisions.
Source Links
- https://dashthis.com/integrations/google-adwords-dashboard/
- https://ads.google.com/intl/en_us/home/tools/manager-accounts/
- https://www.linkedin.com/posts/solutions-8_googleads-googleadstips-googleadsmarketing-activity-7166522472463331328-cPzy
